What it Takes: The 2025 Report on the Last 100 $1B+ Exits
.png)
The Behind Genius 2025 Quantitative Deep Dive in Last 100 $1B+ Tech Exits
Incorporating 45 new $1B+ exits since our first study in April 2025, our 2025 “What It Takes” study update tracks how the drivers of scale, timelines, sectors, and valuation dynamics are evolving in a post-2021 market.
The goal of What it Takes is to give founders, investors, LPs, and operators a clearer picture of what it actually takes to achieve a billion-dollar outcome and how that blueprint is changing in the age of AI.
Key Questions We Cover
- What is the average and median valuation of recent $1B+ exits?
- How concentrated are outcomes among the top deals?
- How is the exit market recovering after the 2022 downturn?
- What revenue levels do companies typically reach before going public?
- Which sectors are producing the most billion-dollar outcomes?
- How long does it actually take to reach a $1B+ exit?
This report provides a quantitative foundation for understanding modern venture outcomes and a forward-looking lens on how the next generation of billion-dollar companies may be built.
While the findings offer a retrospective view of past successes, it is important to recognize that the IPO and M&A deals of yesterday are not necessarily indicative of the trends shaping tomorrow.
If this sparks any questions or thoughts, I invite you to reach out to Chinwuba directly with the subject line "What It Takes" at Chinwuba@behindgeniusventures.com.
2025: An Acceleration of Liquidity
Our 2025 analysis shows a clear and accelerating reopening of the exit environment.
In 2025, 17 IPOs and 29 M&A deals occurred. M&A meaningfully outpaced IPOs.
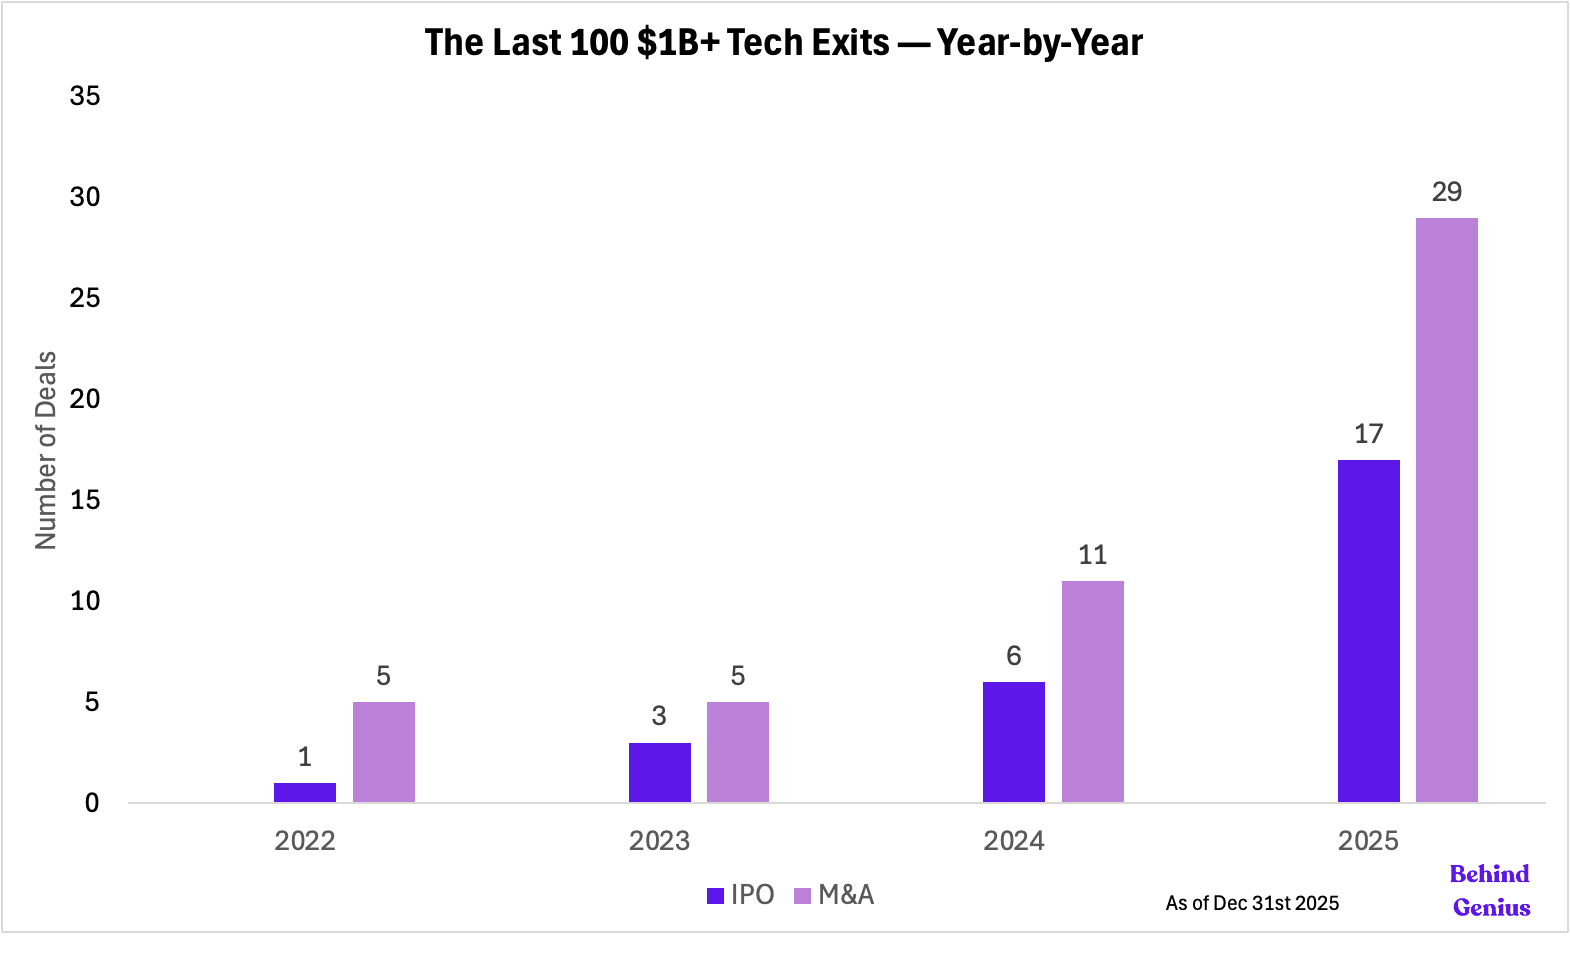
Looking back at the billion-dollar plus exits, just 1 IPO and 5 M&A transactions occurred in 2022, reflecting the shock of rising rates, public market drawdowns, and risk-off capital. Then, 2023 marked stabilization rather than recovery, 3 IPOs and 5 M&A deals, suggesting cautious buyers and public markets. In 2024, the number of exits doubled to 6 IPOs and 11 M&A transactions, featuring disciplined IPOs, strategic acquisitions, and buyers returning with clearer valuation frameworks.
Five New Breakouts: Valuation Outliers and Averages
In 2025, five new companies broke into the top 10 exits with two landmark acquisitions:
- Wiz, $32B acquisition by Google, largest cybersecurity acquisition to date
- Groq, $20B acquisition by NVIDIA, largest in NVIDIA's M&A history to date
- CoreWeave, $23B IPO
- Figma, $19.3B IPO
- Chime, $11.6B IPO
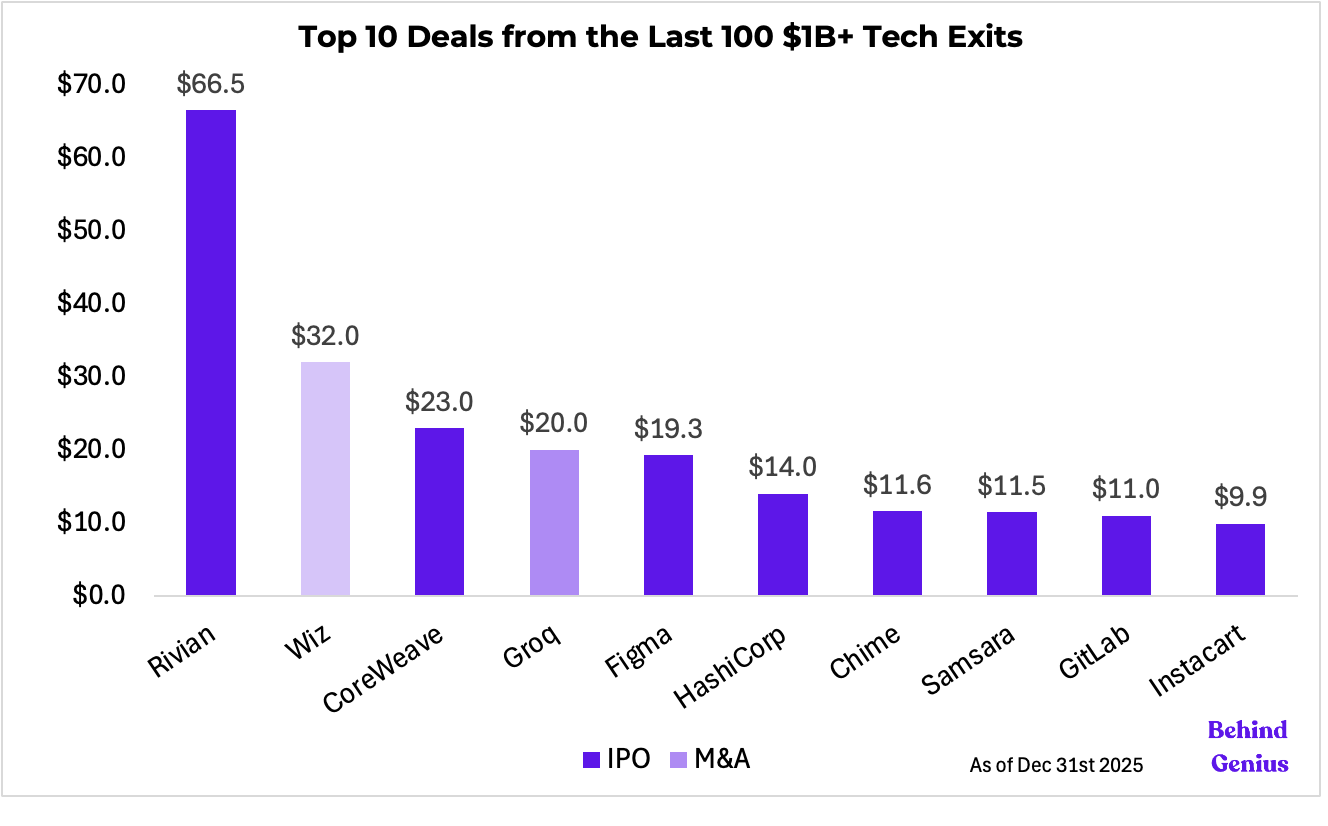
In comparison to our 2025 study, the average valuation in the study was the same at $4.8B, and Rivian’s $66.5B IPO is still the largest exit in the study.
- Highest valuation: Rivian at $66.50B
- Lowest valuation(s): Several companies at $1.00B
- Average valuation: ~$4.8B
- Median valuation: $2.5B
Top 10 Exits Accounted for 45.10% of Value
The top 10 exits accounted for 45.10% of total deal value ($218.8B out of $485.18B): Rivian, CoreWeave, Figma, HashiCorp, GitLab, Samsara, Instacart, Chime, Klaviyo, Beta Technologies.
Rivian's $66.5B IPO alone represents about 13.7% of total deal value, though their market cap has dropped to ~$25B.
Top 10 Outliers by Deal Type:
.png)
.png)
Beyond these outliers,
- IPOs average at $6.98B valuation
- Median: $5.10B
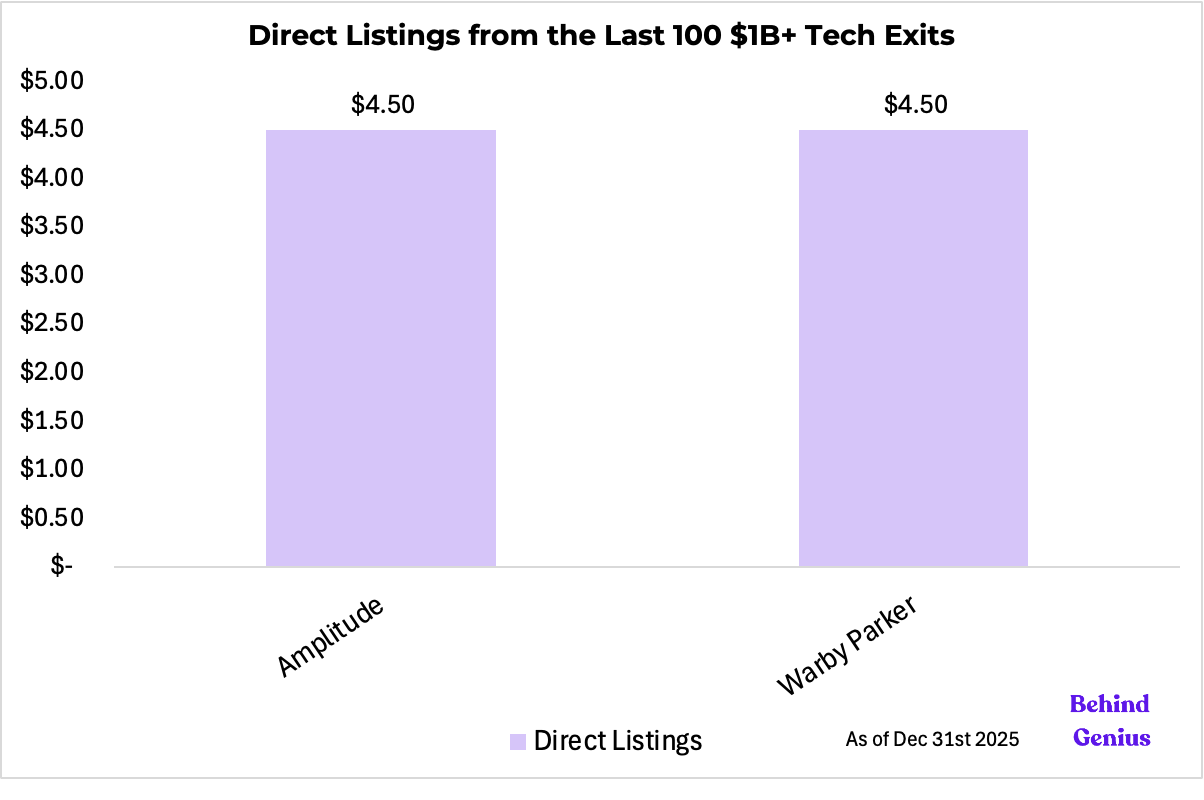
- Direct listings average $4.50B valuation
- Median: $4.5B
- There has been no new direct listing since 2021. An IPO involves a company issuing new shares via underwriters to raise capital. Conversely, a direct listing allows existing shareholders to sell shares directly to the public without underwriting fees or new share creation.
- In the cash-rich environment of 2021, companies used direct listings simply to let shareholders cash out, but as interest rates rose, going public became about raising new money to shore up balance sheets, something traditional IPOs allow, while standard direct listings typically do not.
- M&A transactions average $3.13B valuation
- Median: $1.75B
California Dominates with $290B in Exits
.png)
California's $290B in exits reinforces its position as the dominant tech hub, nearly one-third of the total exit value in the dataset.
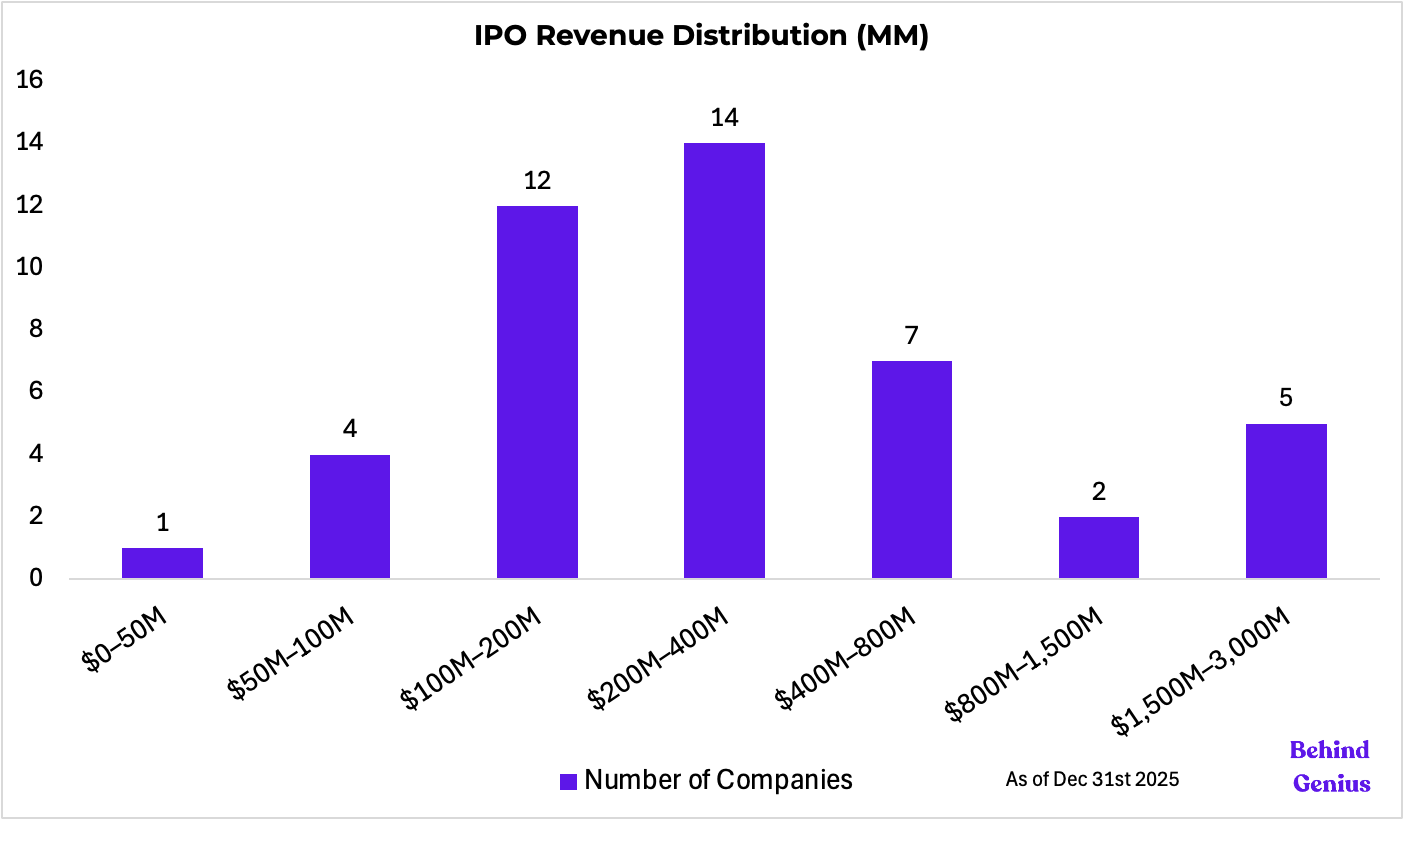
Revenue at IPO Clusters Around $200-400M
Our revenue analysis below is limited to public exits because reliable revenue data for private M&A transactions is generally unavailable. The data is therefore directionally informative rather than fully comprehensive.
Revenue and Revenue Multiples at IPO / Direct Listing
- Average revenue: $508M
- Median revenue: $320M
- Average multiple: 23.8x
- Adjusted Average Multiple: 17x - Beta (outlier) is bringing up the average significantly. While Beta Technology's current revenue is low ($29M), normalizing the valuation multiple requires factoring in its confirmed order backlog of approximately $3.5 billion.
- Median multiple: 11.8x
The densest cluster of companies sits in the $200M to $400M range (roughly 30%).
- Examples: GitLab, HashiCorp, Sweetgreen, Ibotta, NerdWallet, Samsara.
- $200M to $400M appears to be the standard "maturity" benchmark for IPOs. Companies in this bracket have proven product-market fit and scalability but still have significant growth runway ahead, making them attractive to public market investors.
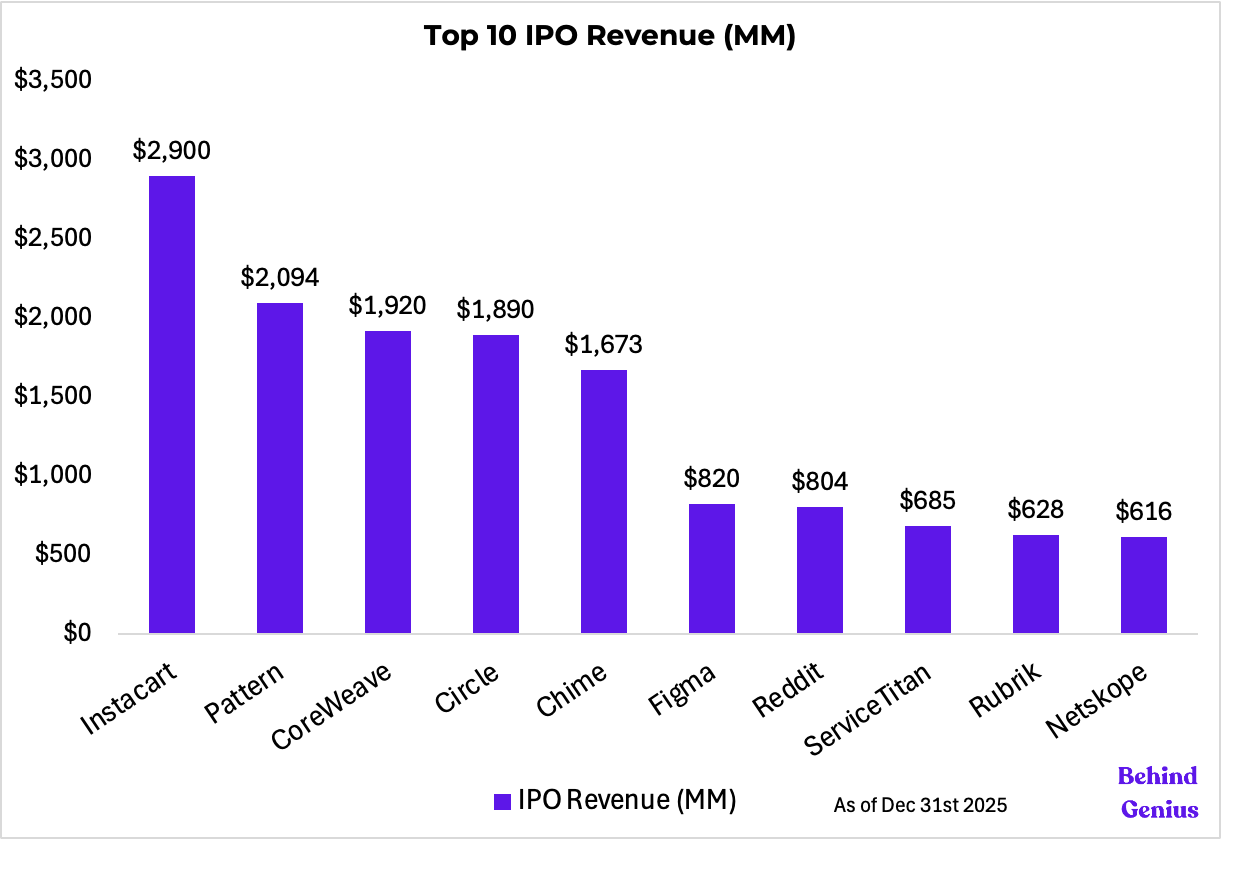
The top 10% of this list skews the average significantly, to $508M.
Companies like Instacart ($2.9B revenue at IPO), Pattern ($2.09B), CoreWeave ($1.9B), and Circle ($1.89B) are listing with revenues that rival established Fortune 500 companies. These companies scaled deeply in the private markets (likely over 10+ years or through massive late-stage VC rounds) before entering the public markets. They are arriving as "giants" rather than "growth stories."
There is no single revenue number required to go public. The range here is enormous, from $23M (Beta Technologies) to $2.9B (Instacart). This suggests that while revenue is a key metric, the type of company dictates when it lists:
- Deep Tech/Hardware (e.g., Beta Technologies, Pony.ai) often lists earlier on the revenue curve ($20M–$90M), likely to raise capital for capital-intensive R&D.
- Marketplaces/Consumer (e.g., Instacart, Chime) tend to list much later, often waiting until they have amassed massive scale ($1B+).
Sector-Wise Fintech Sweeps, Consumer Second, Enterprise SaaS Third
In our 2025 update, we consolidated sectors into a simpler structure. The taxonomy can still be refined, but for now this framework is directionally correct and sufficient for the analysis.
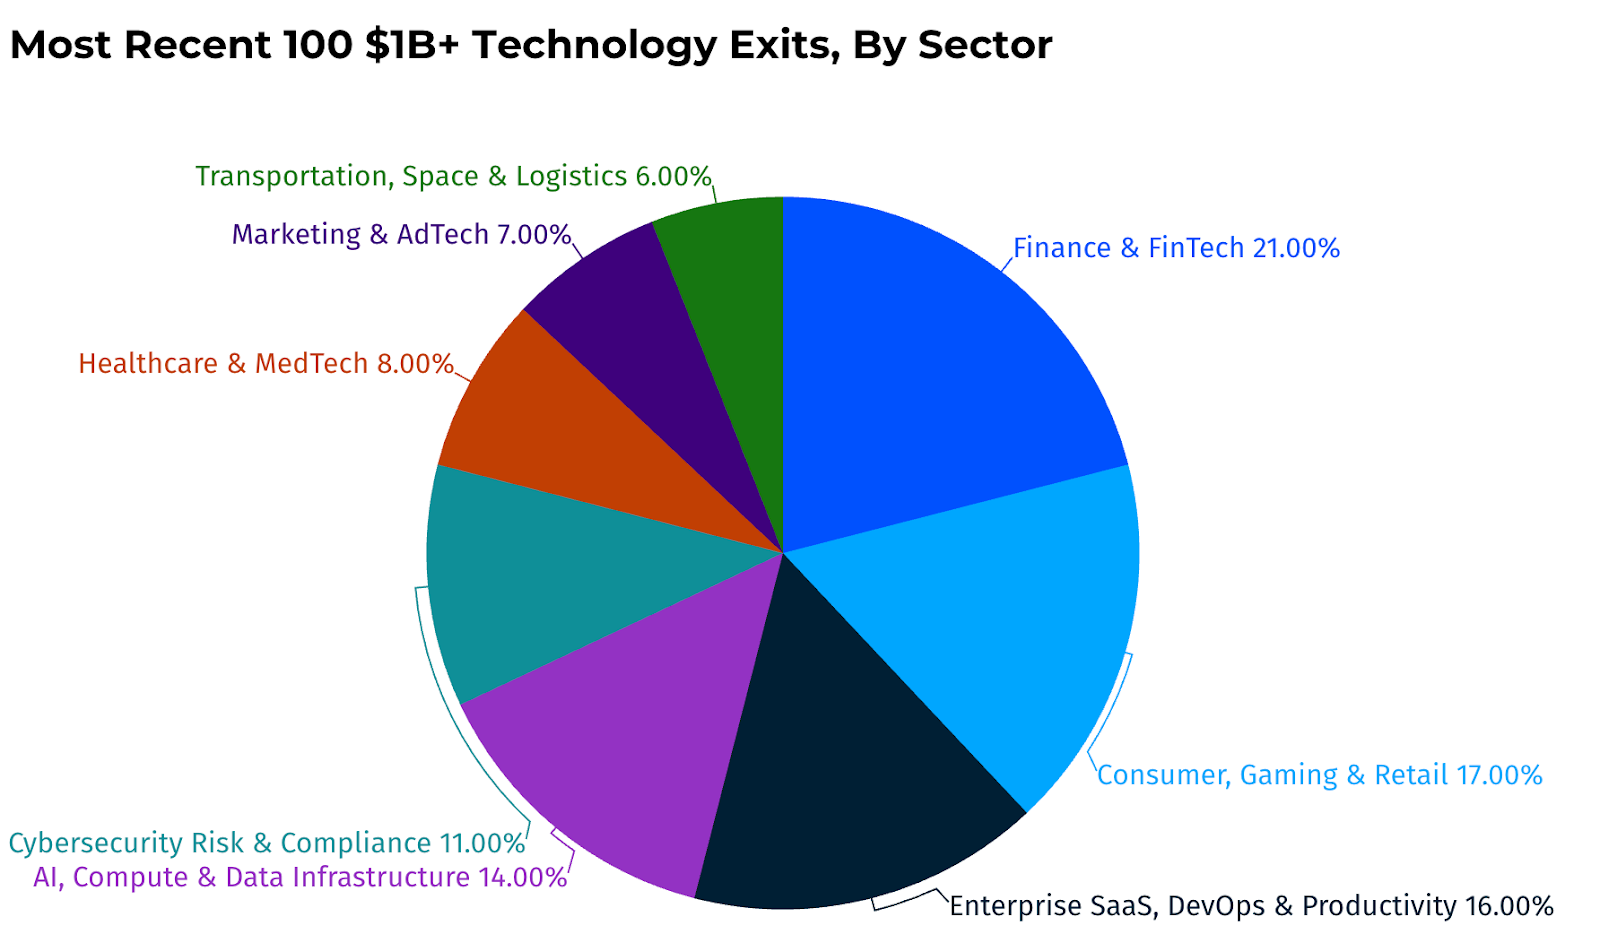
Finance & FinTech (21%):
Emerged as the dominant cohort, with winners spanning
- B2B workflow-embedded payments (Navan, AvidXchange, Expensify)
- consumer financial automation and access (Chime, Wealthfront, Rocket Money)
- foundational “financial plumbing” infrastructure (Circle, Bridge),
underscoring that the largest exits didn’t merely move money, they rewired the operating systems of businesses and households.
Consumer, Gaming & Retail (17%):
The majority of these were founded between 2005 and 2012, proving that category-defining consumer outcomes often require a decade or more of compounding to mature from "thin-margin apps" into durable economic engines.
Billion-dollar-plus winners in consumer, gaming, and retail span a barbell:
- High-velocity CPG and food brands (Poppi, BodyArmor, Sweetgreen) that won through tangible product differentiation and mass retail distribution.
- Digital ecosystems and marketplaces (Reddit, Instacart, Scopely) that achieved leverage through network effects. This isn't just about "users"; it is about vertically integrated operations (Warby Parker, Oddity) and strong IP that can monetize attention, whether that’s via a gaming screen or a grocery shelf.
Enterprise SaaS, DevOps & Productivity (16%):
Horizontal platforms like Figma, GitLab, HashiCorp, and Amplitude became mission-critical infrastructure for the modern software supply chain, while vertical SaaS leaders such as ServiceTitan, Samsara, OpenGov, and SevenRooms unlocked massive value by turning legacy, pen-and-paper industries into systems of record, reinforced by governance and ERP anchors like AuditBoard and Acumatica.
AI, Compute & Data Infrastructure (14%):
This cohort is defined by a compute-stack arms race, where specialized silicon and optical connectivity players (Groq, Ampere, Astera Labs, Credo, Celestial AI) shattered traditional bottlenecks, GPU access platforms like CoreWeave and AMD Pensando scaled the infrastructure of access, and control-plane software (Weights & Biases, Mosaic ML, Chronosphere, Neon) captured value as the pick-and-shovel layer solving bandwidth, latency, and power constraints.
Cybersecurity Risk & Compliance (11%):
The rise of Wiz and Netskope, validate that securing cloud infrastructure and the distributed edge is the new primary battleground, while Rubrik, Own Company, and Venafi demonstrate that "resilience", the ability to protect identities and recover data after a breach, is now a massive asset class distinct from simple prevention.
Armis and Nozomi Networks capture the growing value in securing the vulnerable IoT/OT layer, while Recorded Future and Exiger prove that cybersecurity has evolved into a board-level intelligence function, essential for navigating global threats and supply chain risks.
Healthcare & MedTech (8%):
This cohort is driven by value-based care and real cost reduction, with outcomes- and home-centric providers (VillageMD, CareBridge).
Hinge Health and Omada Health prove that digital health has matured from general wellness into a precise tool for managing high-cost chronic populations like musculoskeletal and metabolic patients, infrastructure players fixing payer and clinical back-ends (HealthEdge, Iodine Software), and hard-science innovators (HistoSonics, Paragon 28) proving that robotics and orthopedics still have a place.
Marketing & AdTech (7%):
The success of Klaviyo and Braze highlights the industry's new "gold standard": leveraging first-party data to drive sophisticated customer engagement and lifetime value. MNTN and Teads migrated budgets to measurable channels like Connected TV and outstream video.
Rounding out this ecosystem are operational accelerators like Pattern and insight platforms like UserTesting, proving that the modern marketing stack is no longer just about "buying eyeballs," but about bridging the gap between deep customer understanding, actual e-commerce execution, and automated relationship management.
Transportation, Space & Logistics (6%):
Electrification and decarbonization leaders (Rivian, Beta Technologies), network-optimization platforms (Deliverr, Via), and long-horizon autonomy and space bets (Pony.ai, Voyager) prove that capital-intensive innovation reshaping physical movement can generate enterprise-scale outcomes beyond pure software arbitrage.
Average Time to Exit for Billion-Plus Hits 11 Years, Median 10.5 Years
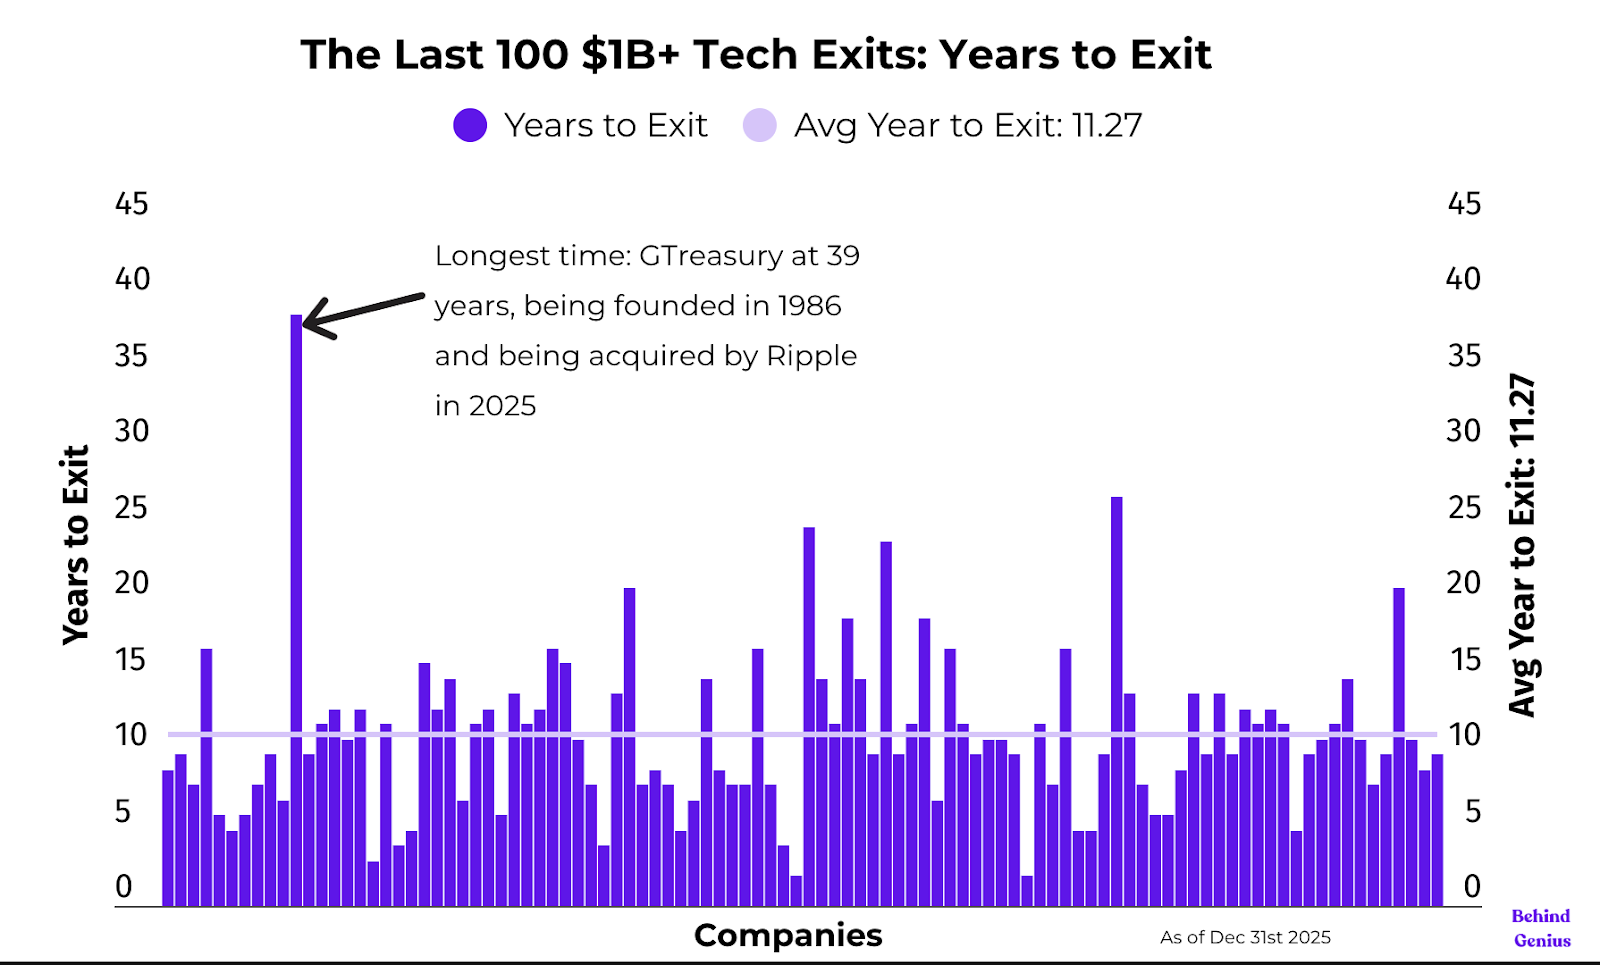
- Average time to exit: 11 Years
- Median time to exit: 10 ½ Years
- Longest time: GTreasury at 39 years, being founded in 1986 and being acquired by Ripple in 2025
- GTreasury was founded by Orazio Manzi-Fe Pater and his wife, Peg Pater, in 1986, with Orazio pioneering automated treasury management systems before stepping down as CEO to become Executive Chairman and eventually transitioning out as the company grew, with Mainsail Partners investing in 2017 and Ripple acquiring the company in 2025.
Bridge and MosaicML Achieve Billion-Dollar-Plus Outcomes in 2 Years
Two companies went from 0 to $1B in 24 months, Mosaic ML from 2021-2023 getting acquired by Databricks and Bridge from 2022-2024 getting acquired by Stripe
- Bridge (Acquired by Stripe for $1.1B):
- Situation: Stablecoins (USDC, USDT) were rapidly moving from "crypto gambling chips" to legitimate cross-border payment rails. Stripe, the king of payments, risked letting a new competitor displace them for international money movement.
- The Solution: Bridge built the "Stripe for Stablecoins", APIs that let companies move money between fiat (dollars) and crypto without touching complex blockchains.
- Speed Factor: Bridge was already processing $5B+ in annualized volume. For Stripe to build this compliance and liquidity network from scratch would be slow and regulatory hell. Buying Bridge let them own the rail immediately.
- MosaicML (Acquired by Databricks for $1.3B):
- Situation: In early 2023, ChatGPT launched, and suddenly every enterprise wanted their own AI models.
- The Solution: MosaicML, started in 2021, had already built the messy, difficult software stack needed to train Large Language Models (LLMs) efficiently on private data.
- Speed Factor: If Databricks tried to build this internally, it would have taken 12–18 months. Mosaic's technology directly complemented their data platform and customer base of companies looking to build proprietary AI models. They paid $1.3B to save that time.
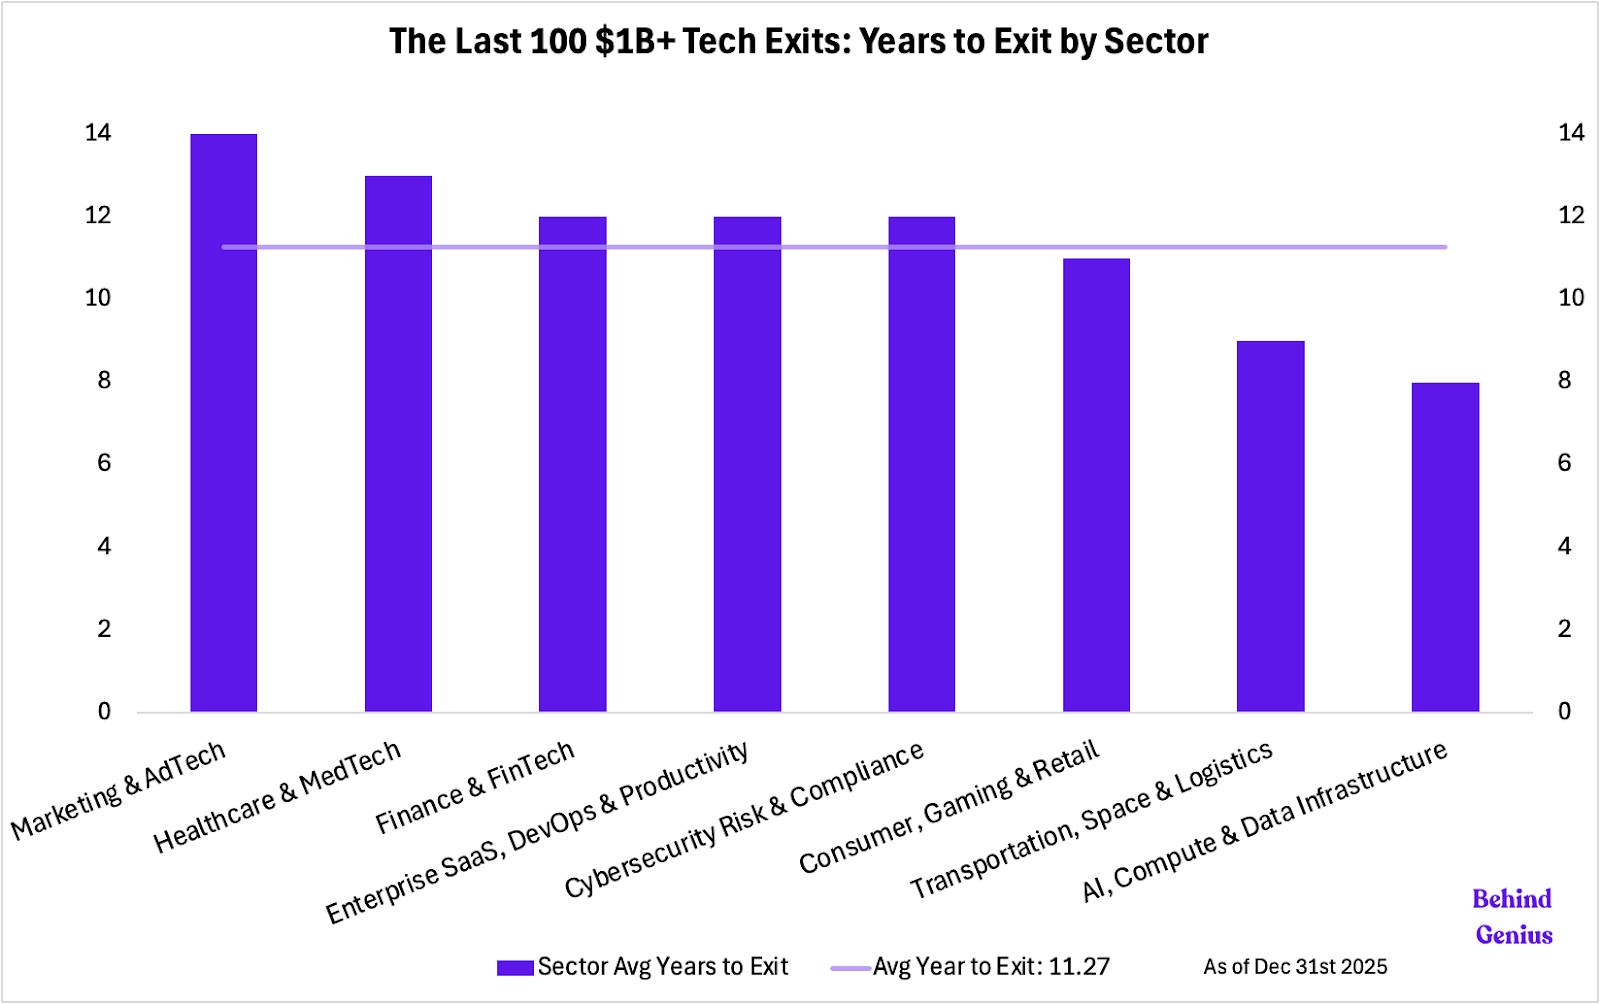
AI, Compute & Data Infrastructure stands out with the shortest time at 8 years
This sector serves as strong validation for the 8-year "Fast Track" average, with the majority of these companies exiting via high-profile IPOs or acquisitions between 2024 and 2025. Driven by an insatiable demand for AI "plumbing," strategic buyers like NVIDIA and ServiceNow aggressively acquired firms like Groq and Moveworks in their prime (years 7–9) rather than waiting for them to fully mature.
Even faster exits, such as MosaicML and Windsurf, highlight a "buy-to-own" frenzy where critical infrastructure is purchased for immediate integration often before commercial operations fully scale. While legacy players like Credo and Nasuni took the traditional long road, the overall dataset confirms that the velocity of liquidity in AI infrastructure is currently higher than in any other sector.
As the last 100 showed, the path to an exit is often a marathon, not a sprint. The data reveals that most companies require 10 to 12 years to reach an acquisition or IPO, highlighting the importance of long-term vision and endurance.
While headlines may spotlight rapid successes, quick exits, those achieved in under five years, remain the exception, not the rule.
A Trillion Dollar 2026?
Looking ahead, 2026 is shaping up to be a blockbuster year of exits.
In our Summer 2025 Guide on Secondaries, we found secondary markets demonstrate a high level of interest in the following companies:
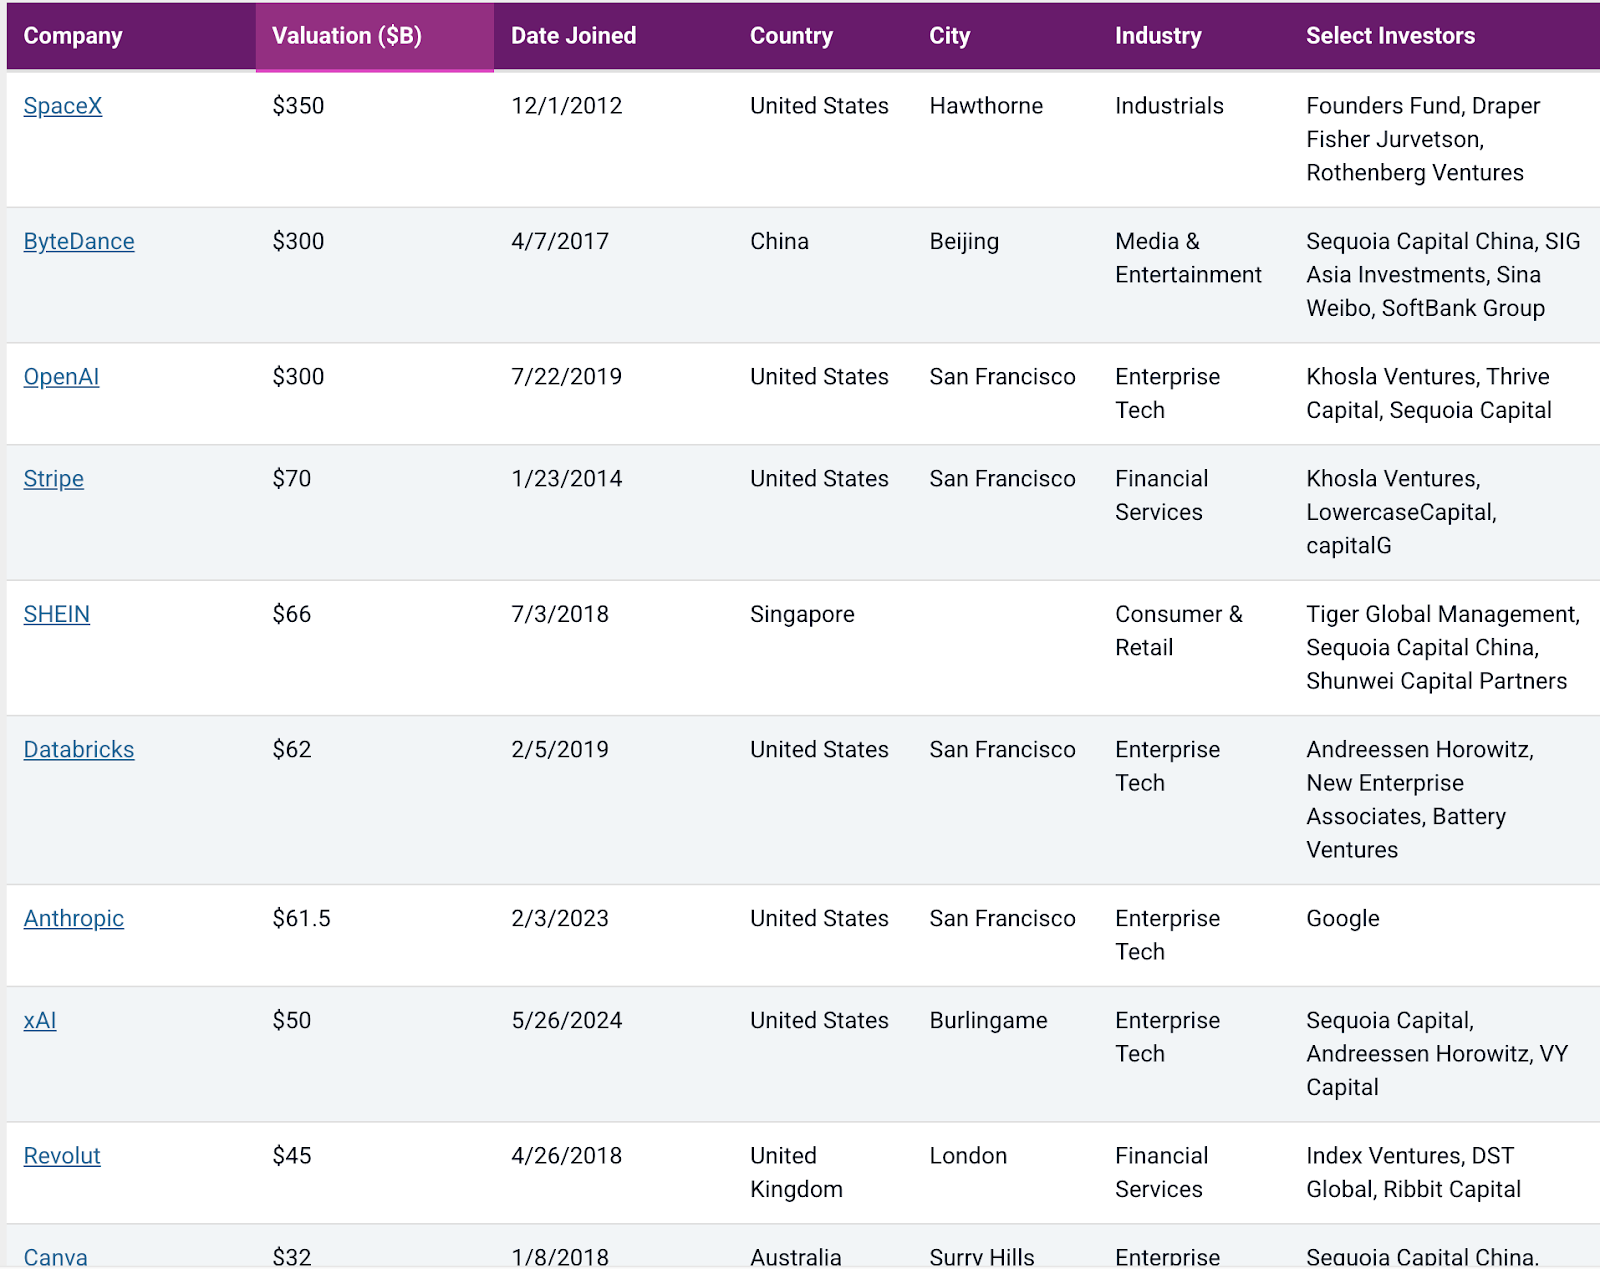
Notably since our secondaries report last summer, Anthropic recently raised $30B at $350B valuation, SpaceX merged with xAI at a $1.25 trillion dollar valuation and has been teasing a trillion-dollar-plus 2026 IPO, ChatGPT makers OpenAI have been in rumored talks to raise upwards of $100B, Stripe is conducting a tender offer at $140B.
Depending on timing of key exits like SpaceX, Anthropic, and OpenAI, we predict the total 2026 exit value could soar to well north of a trillion dollars.
Conclusion: Decoding the DNA of Scale
We conduct this annual deep dive to ground venture strategy in market reality. While this dataset represents a retrospective view of companies built largely in the last cycle, the fundamentals of value creation remain constant.
The data proves that true scale generally requires significant ($200- $400M) in revenue and, most importantly, endurance, averaging an 11-year journey to a billion-dollar-plus exit.
However, the map is shifting. The inclusion of AI infrastructure has begun to compress timelines, with companies like Bridge and MosaicML achieving billion-dollar-plus outcomes in a fraction of the historical average.
As the exit landscape evolves from the cloud era to the AI era, we look forward to tracking how these new physics define the next 100 exits.
If this sparks any questions or thoughts, I invite you to reach out to me directly at Chinwuba@behindgeniusventures.com. Please use the subject line: 'What it Takes' so I don't miss it.
Scope
Key inclusion criteria for a billion-dollar exit are:
- Venture-funded: Companies that received venture capital backing.
- Sector Focus: Primarily software companies, with some representation from adjacent sectors like DTC.
- Exclusions: Biotech companies, SPAC-driven exits, and mega-cap entities outside the venture funding domain.
Methodology
The data for this analysis was collected through Crunchbase, as the primary source, and cross-referencing via various new outlets, company websites, and Linkedin to validate key metrics.
The analysis was conducted using Excel to explore trends and correlations across variables such as IPO valuation, years to exit, founder characteristics, and sector-specific performance.
While the dataset provides valuable insights, it is important to note that not all data in Crunchbase/Web is consistently accurate, representing a potential limitation to the analysis. While we previously looked at the amount raised, we felt the lack of accurate data in sources like Pitchbook and Crunchbase made it challenging to present accurate conclusions.